
AutoFEM Analysis Postprocessor
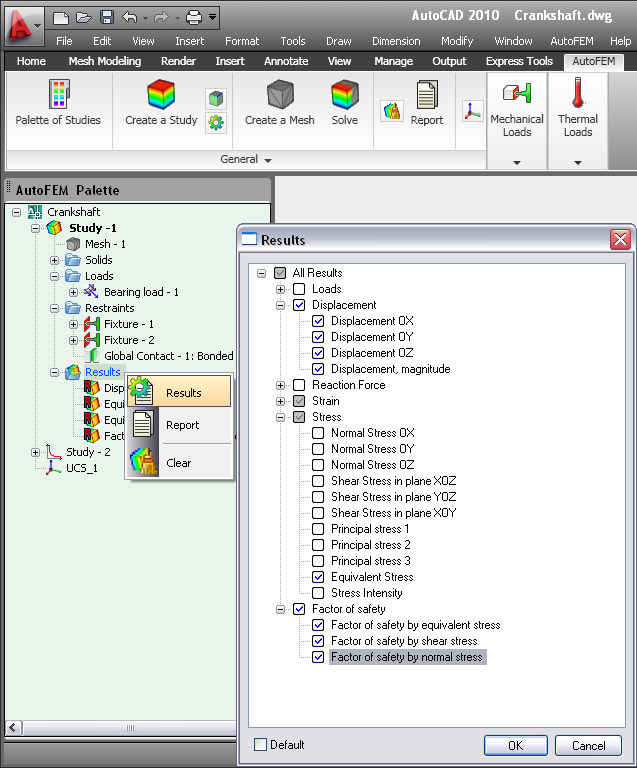
At the last stage of the finite element modelling there is a review and analysis of results. Within the framework of AutoFEM Analysis Postprocessor the available results are displayed in the "Palette of Studies" (folder "Results"). The user can change the list of results he/she needs to display by using the "Results" command in the contextual menu.
It is possible to open several windows for some of the different results.

Visualization of the results can be flexibly configured using the option dialog in the Postprocessor window. The user can set colors, the scale of the deformed model grid, boundary conditions, loop models, etc. Adjusting the colour scale is needed if you want get a more expressive representation of results.

Options dialog of postprocessor window.
The user has vast possibilities of setting up display numeric values. You can use several predefined types of color scales, and also have the unique opportunity of flexible adjustment of the scale of any color filling. There is opportunity to establish user-defined minimums, maximums and flexible font settings.

Setting window of the color scale.
Often it is needed to analyze the results obtained within the 3D model. To do this, use the command “Section”, which allows you to create a sliced model with the desired angle and view the results.

Cross section on stress diagram.
AutoFEM Analysis Postprocessor has an unique opportunity of a dynamic view of the numerical results by means of moving the mouse over the surface of the deformed finite element model, i.e., sensing. There is also command “Extreme Labels” which shows the points with the maximum and minimum of the resulting value.

Using the extreme and floating labels for indicating the result's value.
The user can create .avi file with the animated result. This movie can be send to the customer to illustrate the result of the finite-element analysis or to be used for better understanding of physical phenomena and for educational purposes, too. It is possible to create a "Report", which is independent of AutoFEM Analysis electronic document and containing basic information about the study. The report is generated in html-format; viewing is possible in any browser, for example, MS Internet Explorer.

Creating a report in html format.
Thus, AutoFEM Analysis has a vast potential of analyzing the results of the finite element analysis and of their representation for customers; also it might be used in the production sector of economy.
You can see it yourself using